Healthcare Prices Significantly Vary Across the US, HCCI Finds
Healthcare prices are rising, but some metro areas are significantly more expensive than others and the underlying drivers are different from place to place.

Source: Thinkstock
- Healthcare prices not only significantly varied across metro areas, but also within metro areas, a new analysis from the Health Care Cost Institute (HCCI) showed.
In its first report part of the Healthy Marketplace Index (HMI) project, HCCI analyzed over 1.78 billion commercial claims for healthcare services delivered in 112 metro areas across the country from 2012 to 2015.
The analysis funded by the Robert Wood Johnson Foundation showed that healthcare prices for patients with employer-sponsored coverage were “heavily skewed” across the country.
“Across the US, healthcare prices are rising, but what we saw is that certain areas were dramatically more expensive than others,” Bill Johnson, PhD, study author and senior researcher at HCCI, stated in a press release. “There wasn’t one single reason a particular area had high or rising prices – the underlying drivers varied from place to place.”
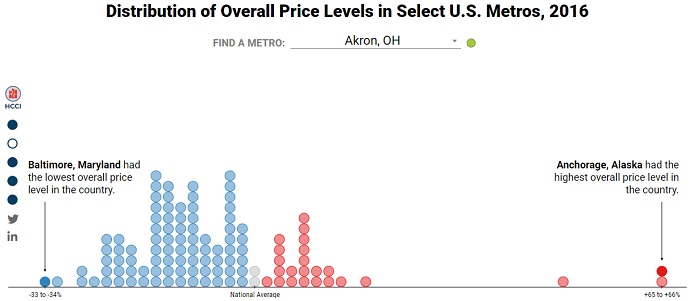
For example, healthcare prices in Anchorage, Alaska were 65 percent above the national average. Other major outliers with prices well above the national average were San Jose, California (65 percent) and San Francisco, California (49 percent).
Source: Health Care Cost Institute (HCCI)
On the other hand, Baltimore, Maryland had the lowest overall healthcare price level in 2016. Prices in the metro region were 33 percent below the national average, meaning prices in the most expensive metro (Anchorage) were almost 2.5 times greater compared to the prices in Baltimore.
Overall, HCCI found that 86 of the 112 metro areas analyzed had healthcare prices below the national average.
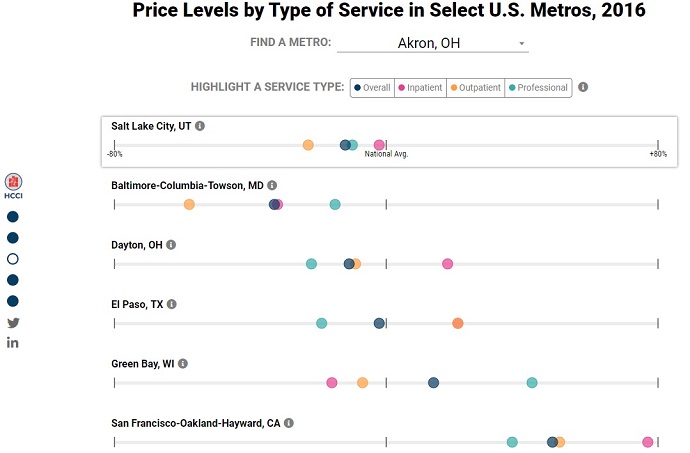
Healthcare prices were significantly different across the country because of market-level differences in price levels and growth for specific healthcare services. HCCI analyzed billions of claims in three healthcare service categories – inpatient, outpatient, and professional services.
Some metro areas had consistently high or low prices across all three healthcare service categories, HCCI researchers reported. For instance, Baltimore had consistently lower-than-average prices for inpatient, outpatient, and professional services, while San Francisco had consistently higher-than-average prices across all three service categories.
However, most metro areas reported outlier price levels across the healthcare service categories, the data revealed.
Source: Health Care Cost Institute (HCCI)
For example, physician and other ambulatory care prices in Green Bay, Wisconsin were 43 percent over the national average. Meanwhile, inpatient and outpatient prices were 16 percent and 7 percent below the national average, respectively.
Patients with employer-sponsored coverage in El Paso, Texas faced a different situation. Professional service prices in the southern metro area were actually 19 percent below the national average, and inpatient and outpatient services were both 21 percent above the average price across the country.
Researchers notably found that healthcare price growth and level were not always related. Metro areas with higher-than-average prices also experienced low price growth and vice versa, the analysis stated.
Tampa, Florida was a prime example of how healthcare price growth and level were not necessarily related, researchers pointed out. Healthcare prices in the areas increased more than any other areas since 2012. The prices grew 21 percent between 2012 and 2016.
However, healthcare prices in Tampa, Florida were still 3 percent below the national average by 2016.
The New York metro area saw similar price growth compared to Tampa, Florida, researchers added. But prices were 10 percent over the national average by 2016 because prices in New York increased from a significantly higher starting point than those in Tampa.
HCCI intends for the analysis to help patients and other healthcare stakeholders understand healthcare price growth in the US. The report allows individuals to compare prices in their metro area to the prices in other regions of the country.
The independent, non-partisan research and analysis organization intends for the interactive report to help healthcare stakeholders better understand the factors that are creating market-level variation in healthcare spending.
Additionally, future reports in the Healthy Marketplace Index (HMI) project will focus on healthcare utilization, spending, market competition, and waste.
“HCCI is committed to fostering greater transparency into the drivers of healthcare costs both nationally and regionally. This, and subsequent HMI releases are intended to do just that,” said Niall Brennan, MPP, President and CEO of HCCI.