MSSP ACOs Decreased Spending by $1B, Improved Care Quality
ACOs realized greater spending reductions and quality improvements as the Medicare Shared Savings Program matured, the OIG found.

Source: Thinkstock
- Accountable care organizations (ACOs) participating in the first three years of the Medicare Shared Savings Program (MSSP) reduced Medicare spending, with a net reduction of almost $1 billion, according to a new OIG report.
The analysis of 428 MSSP ACOs also showed that the longer an ACO participated in the program, the greater the cost savings were compared to newcomers.
“With any major payment reform, time may be needed for organizations to make changes to improve quality and lower costs,” the federal watchdog wrote. “While policy changes may be warranted, ACOs show promise in reducing spending and improving quality.”
CMS designed the MSSP to help decrease the projected $1.4 trillion in Medicare spending by 2027. Through financial incentives, the federal agency aimed to push ACOs to provide higher quality care, fewer unnecessary services, and preventative care to improve patient outcomes and lower healthcare costs over time.
As one of the biggest alternative payment models, the MSSP accounted for about $168 billion in Medicare spending during the first three years of implementation.
READ MORE: Accountable Care Organizations Grow, But Face New Challenges
However, the OIG found that most ACOs during that time were able to decrease Medicare expenditures. Two-thirds of all MSSP ACOs decreased spending for at least one of the years in which they participated in the initiative.
The longer the ACO was in the program, the greater the likelihood that the organization decreased costs below their benchmark. About 57 percent of ACOs in the MSSP for three years generated costs below their spending target in 2015 compared to just 46 percent of organizations in the program for one year.
ACOs in the program for three years also reduced costs by an average of $10.1 million per organization in 2015, whereas ACOs in the program for one year only decreased costs by an average of $5.4 million per organization.
In total, spending reductions reached $3.4 billion for all ACOs participating in the program for the first three years of implementation.
Although, just 36 out of over 400 ACOs were responsible for roughly one-half of spending reductions and three organizations generated about one-quarter of that amount ($1.7 billion).
READ MORE: The Future of Accountable Care Organizations Involves Risk
Conversely, the 146 MSSP ACOs whose costs exceeded their benchmarks for each of the years they participated in the program increased spending by $2.4 billion during the study’s period. Approximately one-half of the increase stemmed from just 38 ACOs.
In total, ACOs reported a net spending reduction of nearly $1 billion during the program’s first few years, with cost savings increasing as the MSSP matured.
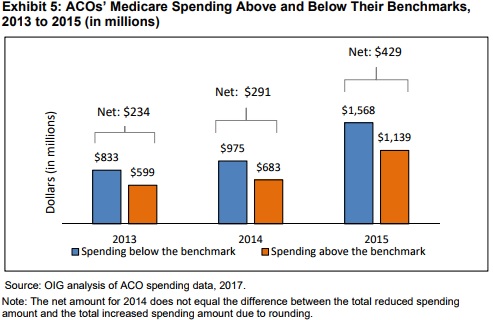
Source: HHS Office of the Inspector General
In the first year, the net spending reduction totaled $234 million and increased to $429 million by the third year.
With overall spending declines, about one-third of MSSP ACOs earned shared savings payments in at least one year of participation.
The ACOs that qualified for shared savings payments dropped spending by $2.8 billion from 2013 to 2015, resulting in $1.3 billion in aggregate shared savings payments.
READ MORE: How Pioneer ACOs Earn Shared Savings, Improve Care Quality
In terms of individual organizations, each organization earning shared savings received about $4.8 million on average for every year that they qualified for the incentive payment.
But the OIG pointed out that organizations receiving the payment in each of the three years tended to have higher spending benchmarks compared to ACOs that did not qualify. For example, the average benchmark for ACOs that earned the payment in 2015 was $11,748 per beneficiary versus $10,284 per beneficiary for organizations without the payment.
“ACOs with higher benchmarks may have greater opportunities to reduce unnecessary costs than ACOs that have lower benchmarks,” the federal agency wrote.
Additionally, the OIG reported that MSSP ACOs improved care quality as spending declined in the program’s first years. Overall quality scores rose from an average of 86 out of 100 in 2014 to 91 in 2015.
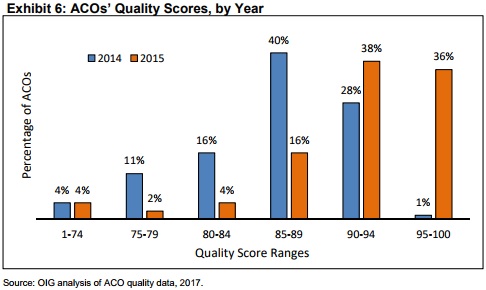
Source: HHS Office of the Inspector General
A greater portion of ACOs also earned quality scores of 90 or above as the program matured, with 29 percent achieving at least a 90 in 2014 to 74 percent by 2015.
Notably, the ACOs advanced their scores on about 82 percent of quality measures, with the percentage of beneficiaries who were screened for depression and percentage of beneficiaries who were screened for fall risk seeing the greatest improvements over time.
However, the OIG noted that quality performance dropped on five measures, with four relating to patient experience. The largest decrease was on the measure quantifying the number of beneficiaries who received a blood pressure screening with any necessary follow-up, which declined from a median of 86 percent in 2013 to 74 percent in 2015.
The report also showed that MSSP ACOs scored higher than fee-for-service providers on most quality measures. ACOs outperformed fee-for-service providers on 81 percent of the 27 quality measures used.
The organizations particularly fared better than 90 percent of all fee-for-service providers on low hospital readmission rates and 80 percent of all fee-for-service providers on screenings for future fall risk, primary care physicians qualifying for EHR incentive payments, and depression screens with follow-up.
Over the first three years of the MSSP, the ACOs also improved their quality scores compared to their peers. The organizations outperformed fee-for-service providers on 73 percent of measures in 2013, 77 percent of measures in 2014, and 86 percent of measures in 2015.
Since the analysis showed that a small portion of MSSP ACOs drove spending declines, the OIG also examined the characteristics of high-performing ACOs. The 56 high-performing organizations achieved both spending reductions and high quality scores (90 or above) in 2014, 2015, or both years.
The high-performing ACOs decreased spending by an average of $673 per beneficiary for seven key services, while other ACOs actually boosted spending by $707 per beneficiary on the same services. Fee-for-service providers also increased spending by an average of $673 per beneficiary.
Despite greater cost decreases, OIG noted that the high-performing ACOs had higher average spending per beneficiary for five of the six years between 2010 and 2015 versus other ACOs and the national average.
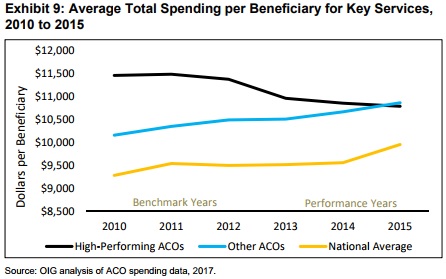
Source: HHS Office of the Inspector General
High-performing ACOs notably decreased spending in inpatient hospital and skilled nursing facility care. Spending on inpatient hospital care dropped from $3,872 per beneficiary in 2010 to $3,324 by 2015.
Other ACOs only reduced their spending on this key service by $76 per beneficiary and the national average dropped by just $32 per beneficiary.
In terms of skilled nursing facility care, high-performing ACOs saw spending drop by almost $287 per beneficiary from 2010 to 2015, while other ACOs increased spending by $25 per beneficiary and the national average rose by $35 per beneficiary.
High-performing ACOs also implemented more “cost-effective changes” than their MSSP peers, the report added. The top organizations provided the greatest number of primary care visits (10.6 per beneficiary) in 2015 compared to other ACOs (10.1 per beneficiary) and the national average (8.6 per beneficiary).
The high-performing group was the only type to decrease the number of emergency department visits per beneficiary, with a reduction of about 1 percent. They also reported the greatest decline in the use of expensive CT scans, with a drop of 17 percent.
In addition to utilization and spending differences, high-performing ACOs also tended to have a larger number of beneficiaries (22,000 in 2015 compared to 19,000 for other ACOs) and were more likely to contain only physicians. Approximately 45 percent of high-performing ACOs in 2015 only included physicians, whereas 36 percent of other ACOs reported the same characteristic.
High-performing ACOs also were more likely to treat beneficiaries with more health conditions and other risk factors related to increased spending.
Building on this research, the OIG plans to further investigate high-performing ACOs.
“Additional information about high-performing ACOs and their specific strategies is needed,” the federal agency wrote. “Understanding the success of such ACOs can inform not only the future direction of the Shared Savings Program, but also other alternative payment models that seek to achieve high-quality care for lower costs.”