Service Prices Drove $933.5B Increase in Healthcare Spending
Service prices and intensity accounted for the greatest portion of healthcare spending growth compared to population size, age, disease prevalence, and utilization.

Source: Thinkstock
- Service prices and intensity represented over one-half of the $933.5 billion increase in healthcare spending between 1996 and 2013, a new Journal of the American Medical Association study revealed.
Prices and intensity were the primary drivers of increased healthcare spending, ahead of population size, population age, disease prevalence or incidence, and healthcare utilization, researchers found using data from the US Disease Expenditure 2013 project and the Global Burden of Disease 2015 study.
The study of 155 health conditions across 36 age and sex groups, 6 types of care, and 18 years uncovered that population size and age were associated with a 23.1 percent and 11.6 percent increase in spending, respectively.
Conversely, changes in disease prevalence or incidence and service utilization resulted in healthcare spending reductions during the study’s period. Disease prevalence or incidence change was associated with a 2.4 percent decrease in spending and service utilization change was linked to a 2.5 percent decrease.
While healthcare prices accounted for the largest share of overall spending increases, researchers noted that the association varied according to type of care and health condition.
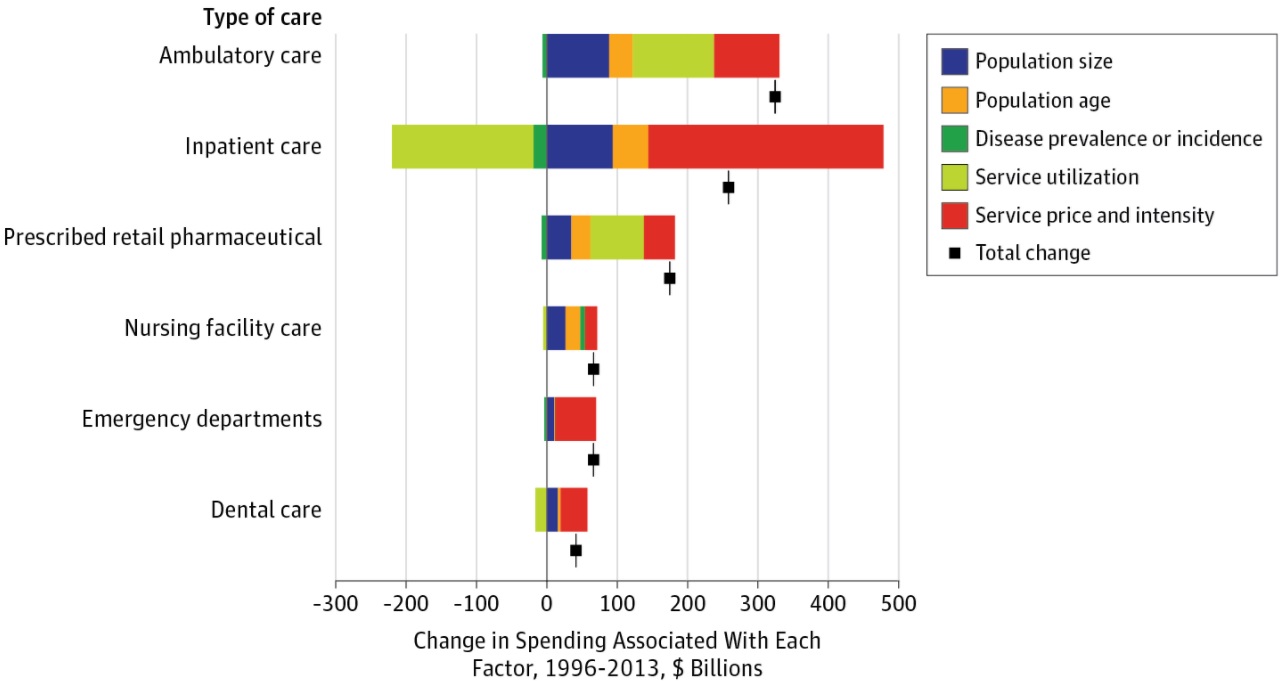
Among the six types of care studied, ambulatory care spending increased the most. The annual spend on ambulatory care increased $324.3 billion over the study’s 18-year period.
Service prices and intensity only accounted for $92.5 billion in ambulatory care spending. Prices and intensity followed service utilization, which represented the greatest driver of increased spending with $115.5 billion.
Source: JAMA
Population size and age only represented $88.6 billion and $33.7 billion of the ambulatory care spending growth, respectively.
Decreases in the number of prevalent cases for expensive health conditions (e.g., ischemic heart disease and hypertension) were associated with a $6 billion reduction in ambulatory care spending.
Annual spending on inpatient care followed ambulatory care in terms of greatest spending increases. Inpatient care spending rose $258.1 billion between 1996 and 2013.
Unlike ambulatory care, healthcare prices and intensity drove greater inpatient care spending. Increases in spending per bed-day resulted in a $333.7 billion boost in annual inpatient spending.
Healthcare utilization also had an opposite relationship compared to ambulatory care. The factor was associated with a $201.1 billion reduction in annual spending.
Although, like ambulatory care spending, population size and age resulted in small spending increases, while disease prevalence or incidence results in slight reductions.
Service prices and intensity also drove increased in emergency department and dental care.
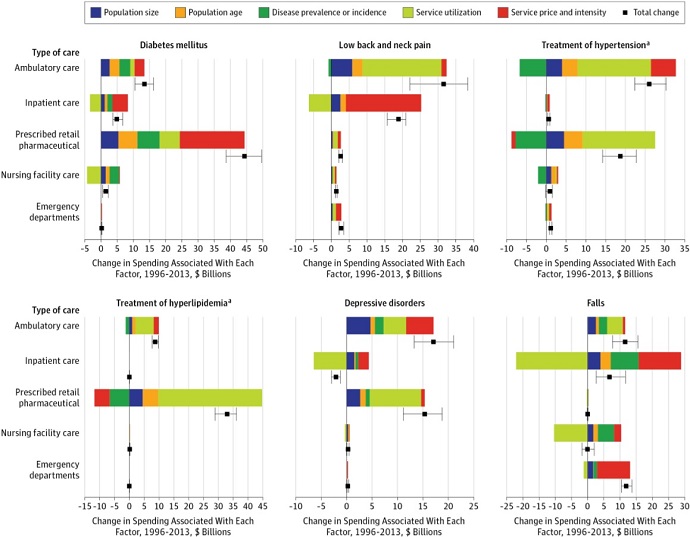
In terms of specific health conditions, service prices and intensity represented the largest increase in spending for diabetes. The factor was associated with a $20 billion boost over the 18-year period.
Source: JAMA
The other four factors also resulted in increased diabetes spending in ambulatory care settings. As a result, diabetes experienced the greatest healthcare spending boost compared to all other studied conditions.
Service prices and intensity also accounted for a large portion of spending increases for the second greatest boost in annual spend by health condition. Low back and neck pain saw ambulatory care spending grow by $31.5 billion and inpatient care spending rise $18.9 billion.
About $21.1 billion of inpatient care spending growth stemmed from service prices and intensity. The factor was the largest driver of inpatient spending on low back and neck pain.
However, the factor was second to utilization for low back and neck pain for ambulatory care settings.
The study’s findings indicated that stakeholders may need to hone in on healthcare prices to bend the cost curve.
Industry leaders have focused on reducing utilization and shifting care to less expensive settings as a method for reducing overall healthcare spending. The effort to change utilization showed in the study. Inpatient utilization decreased between 1996 and 2013 across several health conditions, including cardiovascular conditions, labor and postpartum care, and low back and neck pain.
However, utilization changes were not enough to lower overall healthcare spending because prices and intensity simultaneously increased during the period. Rising inpatient prices and intensity outweighed utilization decreases, resulting in net spending increases.
Other stakeholders have also pointed to a growing, aging population with increased disease prevalence as top drivers of healthcare spending. However, the study uncovered that disease prevalence changes do not always result in increased spending. The factor was actually associated with decreases in spending for inpatient care, as well as hypertension and hyperlipidemia treatment in the pharmaceutical setting.
The study’s finding that service prices and intensity accounted for one-half of healthcare spending increases should influence health policy, researchers stated. Policy should focus on targeting prices to reduce spending. Condition-specific analyses should also help to reduce spending for common conditions, such as increased medication spending for diabetes.