Health Systems, Physicians See Significant Revenue Losses in 2015
A new survey analyzed healthcare revenue cycle losses among medical groups in 2015 to provide operational benchmarks for executives.

- Both integrated healthcare systems and private physician practices saw operating losses in 2015, according to a revenue cycle management survey conducted by the American Medical Group Association.

Integrated healthcare systems saw an operating loss of $211,961 per physician in 2015, whereas private physician practices reported a $13,982 operating loss per physician.
The survey also showed that integrated healthcare systems had significantly lower operating expenses than physician practices. Health systems reported an average cost of $825,741 in total, compared to private practices that had a median of approximately $1.1 million in total operating expenses.
“At a glance, the discrepancy between integrated health systems and private practices seems significant,” stated Tom Dobosenski, CPA, AMGA Consulting president. “It’s essential, however, to look at the many financial indicators that make up operating performance and compare those details across different organizational structures to gain a better understanding of true financial performance.”
The survey of 50 medical groups, representing over 10,000 physicians, was designed to act as a benchmarking tool for healthcare executives to gauge financial performance. The report included financial summaries based on organization size, region, proportion of capitated net revenue, median data on direct expenses, provider compensation, staffing, and accounts receivable information.
The general financial benchmark in 2015 showed that medical groups had a median operating loss of $95,138, with average operating expenses representing 106.7 percent of net revenue.
While medical groups received a median of $1.2 million in gross revenue from professional and surgical services and $352,865 from lab, radiology, imaging, and ancillary services, the top expense for medical groups in 2015 was physician salaries with 41.6 percent of net revenue, followed by medical and surgical supplies and drug expenses with 6.3 percent and building and occupancy expenses with 5.5 percent.
As part of the benchmarking strategy, the survey also investigated healthcare employment trends among medical groups to break down operational budgets in 2015.
Researchers found that medical groups employed more full-time-equivalent patient accounting and central business office, operations, and information technology employees in their operational departments than any other professional group. After adjusting the figures to represent 100 full-time-equivalent physicians, the data shows that operational departments contained a median of 42.9 patient accounting and central business office staff, 19.9 operations employees, and 16.6 IT personnel.

In terms of physician employment, primary care providers topped the provider headcount in 2015. Out of the 50 medical groups, primary care providers made up 41.3 percent of the overall physician headcount, followed by medical specialists (33 percent) and nurse practitioners (22 percent).
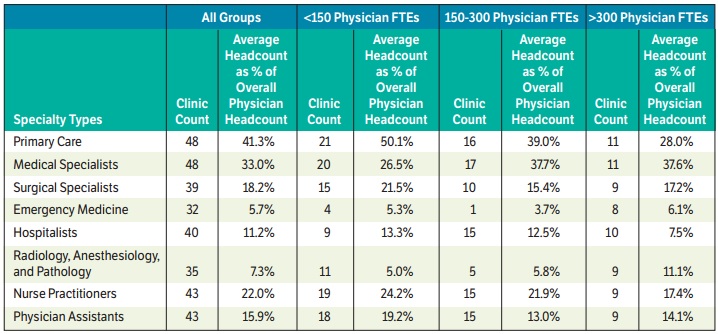
Primary care providers accounted for half of full-time-equivalent providers (50.1 percent) in organizations with fewer than 150 full time physicians versus only 28 percent in medical groups of 300 or more full-time-equivalent physicians.
Despite an emphasis on primary care providers, the AMGA survey showed that specialists received higher physician compensation rates. Gastroenterology providers accrued a median compensation of $558,849 per physician, followed by dermatology providers with $519,752, general cardiology physicians with $509,473 and hematology and medical oncology providers with $491,653.
The survey findings are intended to help medical group executives understand the healthcare market and make revenue cycle management decisions, especially as the industry continues to transition to value-based care.
“Medical groups continue to rise to the challenge to provide quality, cost-effective care in an ever-shifting healthcare environment,” stated Donald W. Fisher, PhD, CAE, AMGA president and chief executive officer. Fischer added that it is “imperative that C-level leaders have access to data that provides a complete picture of the market. This survey will be a valuable tool in benchmarking performance.”
Image Credit: AMGA
Dig Deeper:
• What is Healthcare Revenue Cycle Management?
• Using Revenue Cycle Analytics for Effective Value-Based Care